
One of the odder stats I’ve always noodled over is the character ‘type’ in relation to death. Beyond just looking at raw numbers, I like to try and make sense of what the values actually mean, to better understand the history, how we got here, and where we might end up.
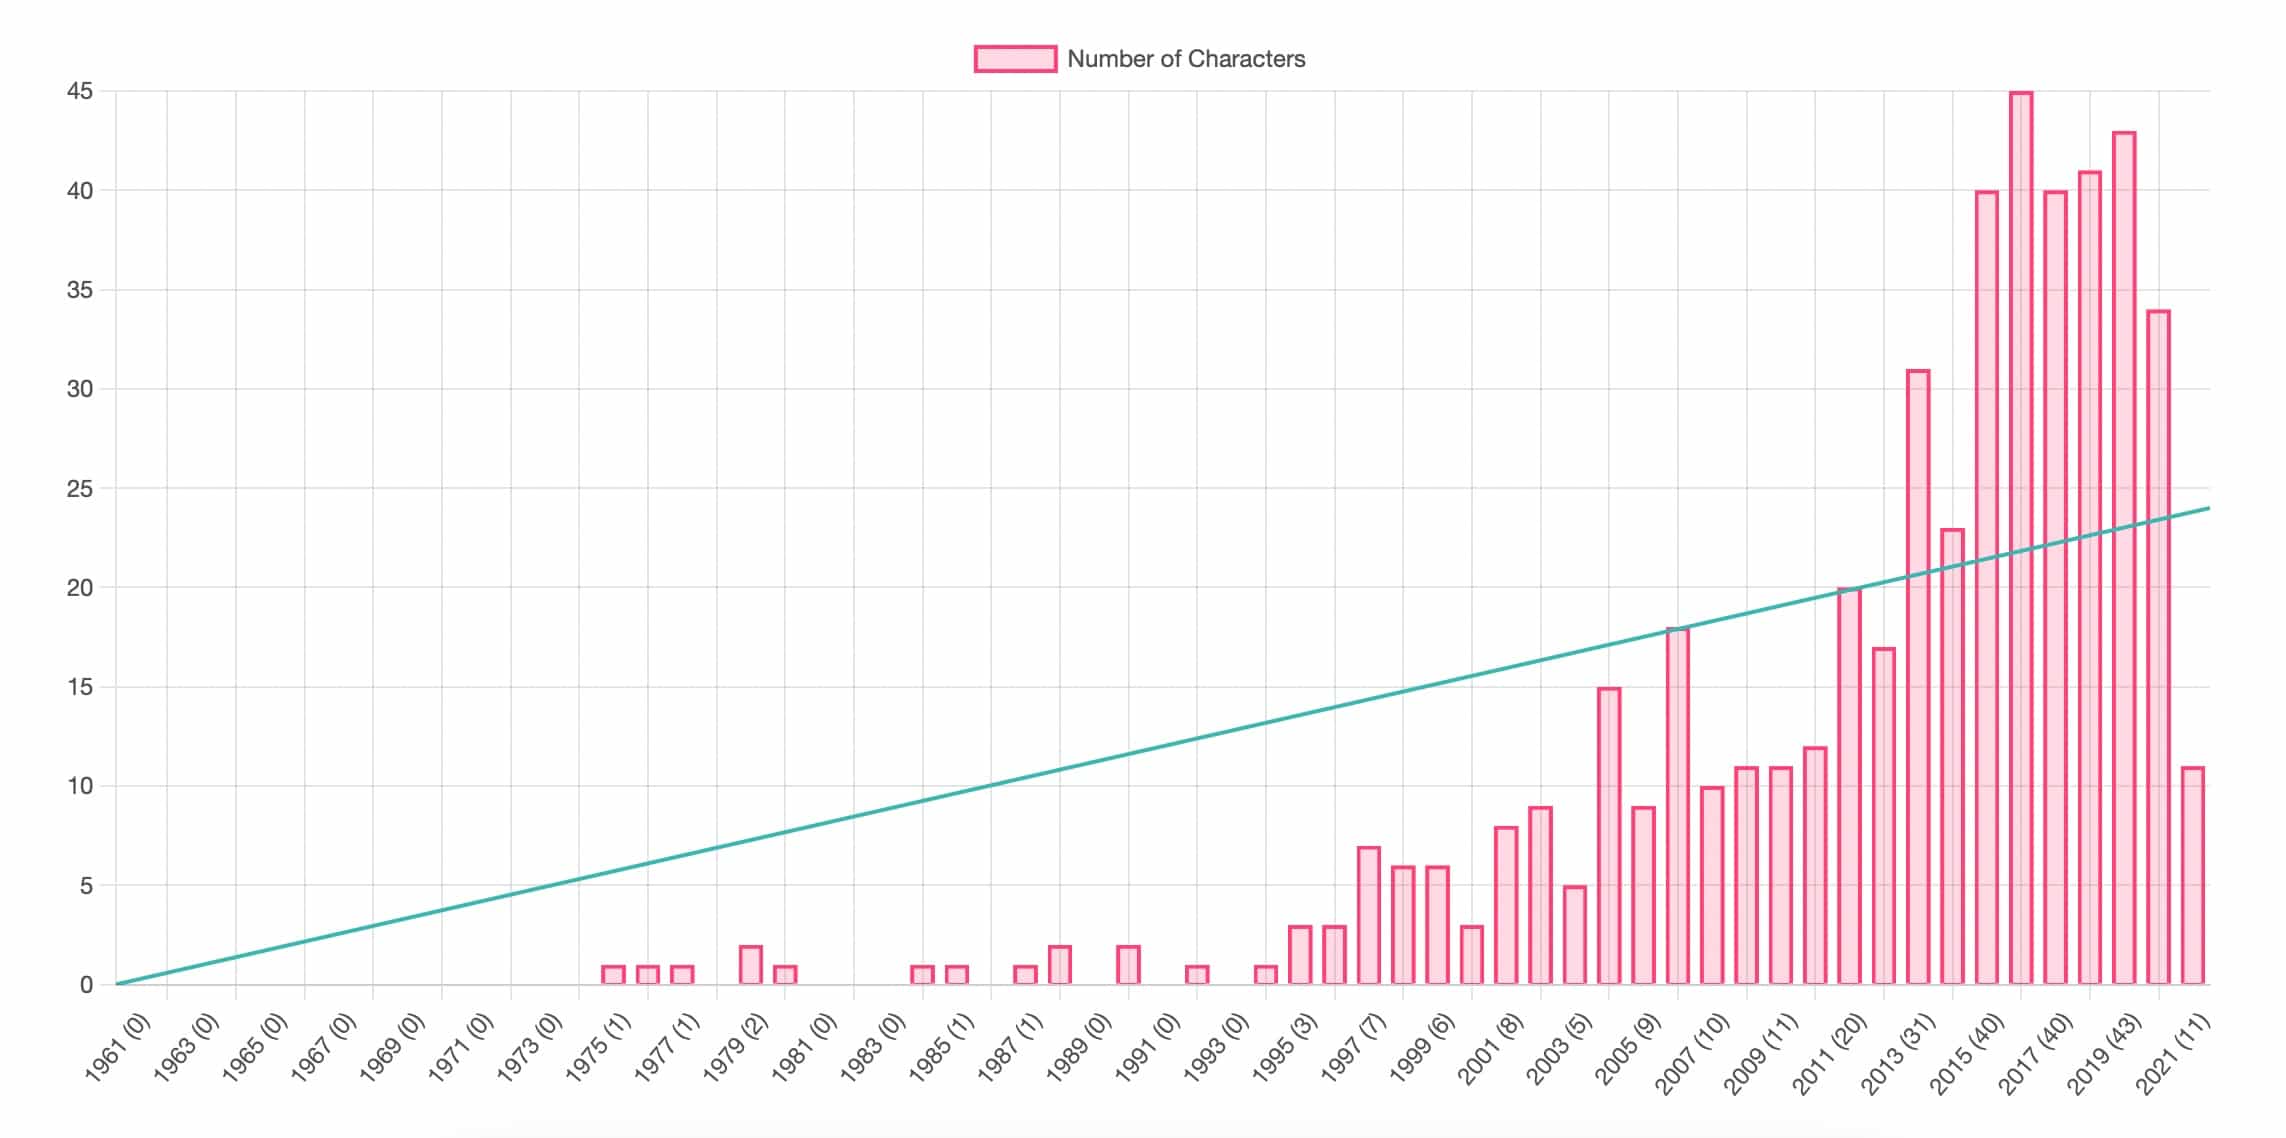
This year has been a remarkable record low in deaths. There are only 12 dead characters to date (13 if you count Sara Lance…), which is a 65% decrease from last year. The record high was 45 in 2016, so this drop, which gets us well below the projection, is surprising. And I wondered if it had to do with the kinds of characters…
Character ‘Type’
There are three primary types of characters:
- Regulars – main characters who are on screen in nearly every episode
- Recurring – frequently occuring characters with their own plots
- Guests – aka ‘Queers of the Week’
There’s always a lot of wiggle room going on between them, as sometimes a show will credit someone as a main cast member when they’re in 2 episodes. For example, AppleTV put Sam Niell (a classic ‘Hey! It’s that guy!’ actor if there was one) as a main character for Invasion but thus far, he’s been in a single episode. Sometimes those demarcations are related to money, contracts, and fame. Sometimes they’re not.
Overall, an Even Split
When you look at the pure, from all time, stats, you can see that it’s a remarkably even split:
- Regular – 183
- Recurring – 151
- Guest – 175

Honestly, I would have expected guest to be much higher, but once I said that out loud, I realized I knew why!
I’ve wanted to try this for a while. The two images below are a ‘before and after’ image compare. The ‘before’ image is just the ‘characters on air per year’ and the ‘after’ is for dead characters per year. Play around with the slider, but you’ll see they are pretty much on par with each other (though death has a higher trend line):

This interests me because it shows how ‘even’ they are. The scales are different, but the relative size is very close, which suggests that the reason that dead characters by type are a near even thirds split is specifically because of that relationship. That is, we see more dead main characters because for a while that’s all we had, other than dead guest of the week.
Change Over Time
In order to test my hypothesis, I went and built out a table of death per year by type… And was surprised.
| Year | Regular | Recurring | Guest |
|---|---|---|---|
| 2021 | 4 | 6 | 3 |
| 2020 | 12 | 12 | 13 |
| 2019 | 19 | 13 | 13 |
| 2018 | 9 | 18 | 14 |
| 2017 | 16 | 13 | 12 |
| 2016 | 20 | 21 | 9 |
| 2015 | 8 | 14 | 19 |
If my premise had been correct, then the numbers for guests would be notably higher than the ones for regulars.
But as you can see, they’re not. In fact, the overall stats are the same year by year by year.
What Does This Mean?
This is the part where I stop. You see, what I don’t have is statistics on non-queer deaths per year, broken down by character type. No one (not even IMDb) keeps tabs on that. But we as TV viewers are generally aware of the trope that Main Characters rarely die. Wounds are cosmetic, etc etc.
My conclusion here is that the fact that this ratio hasn’t really changed in 40 years (and certainly not over the last 5) means that we, as queers, remain disposable.
Here’s hoping 2022 skews a little different.