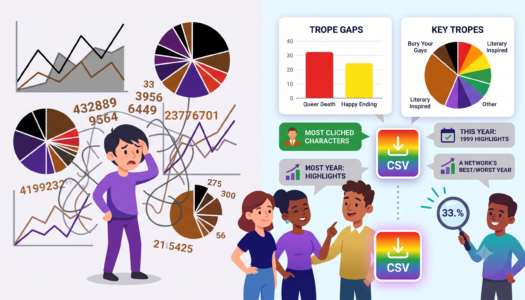
Get Ready For New Stats, Now With Context!
It’s been a decade, it’s time to give the stats a much needed facelift and functional improvement to meet the needs of 2026. Oh, and you can download CSVs now.

2022 In Review
A brief look into the visualization of representation for 2022.

2022: Hindsight, Damn Hindsight, and Statistics
In 2020 and 2021, I looked back at the numbers for shows, as a bit of a canary in a…

Types of Characters Who Die
Understanding the relationship between types of characters and death on TV.

Which Streamer Is Worth It?
Get a view of what streamers are better (for the queers) than others.

2021’s Long Impact on Representation
The trends are still pretty messy thanks to COVID and general changes in what’s on TV.

The Law of TV Averages in Show Scores
Percentages, averages, and a slower growth on show scores gives us an answer of where to see representation on US TV.

Negative Growth Continues
It’s time again to peek at the growth of representation, and take into account some harsher-than-desired facts.

Finding Hope in A Year of Unbalanced TV
The past is coming back to get us through the pandemic, but there will be a cost to content quality.

New Feature: Time Between Death
The year is coming to an end, and we are always moving forward with data representation.

Historical Primetime Popularity
As hard as it is to collect proper data, we’re making a go at figuring out if queer content make your show popular.

Fake News and Popularity
Determining what is and is not popular is not as easy as looking at a list, due to the uncertain nature of the data sources.