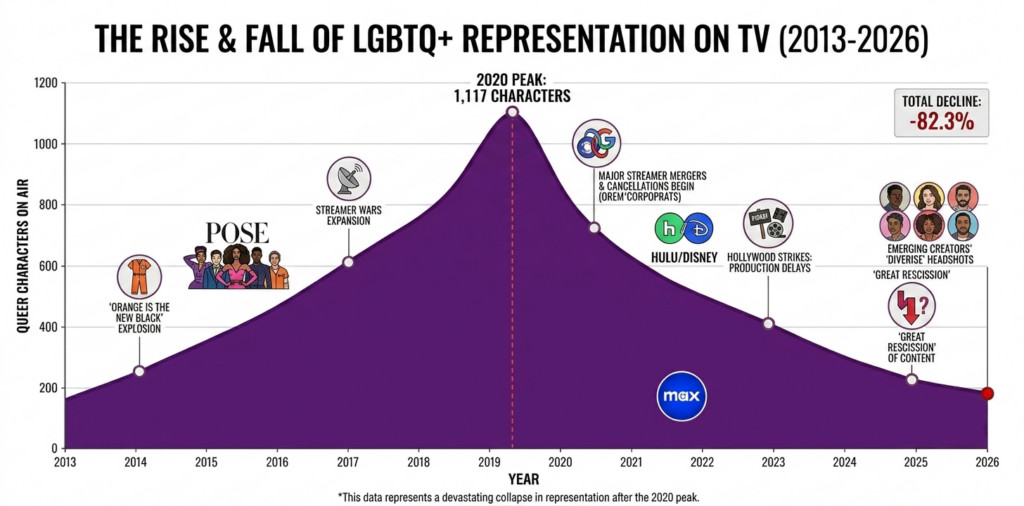
One of the things that happens when I sit down and redesign all the stats (which is finally stable and done until I think of more gaps), is that I end up taking a real good look at what data we have, what can be displayed easily, what needs heavy calculations, and what the end results are. That kind of work is, in fact, what lead to me making posts about representation and how it was increasing.
As regular visitors know, over the last six years, I’ve been marking a tragic plummet of content and representation in what limited content remained. Looking at the last 14 years of data makes my previous statements about how we’re getting less rep glaringly obvious.
In 2020, representation peaked at over 1000 characters on screen. That’s roughly 1/7th of all the characters we’ve tracked. Right now, we sit around 200 characters. Now, I know we’re behind on a lot of data. The ever growing backlog has over 500 characters to add, but most of those are not from this year. And even if they were, it’s still going to be significantly less than we had in 2020.
The Shows Fell First
Here’s something I didn’t fully appreciate until the redesign put the charts side by side: shows on air peaked in 2018, at 546. Characters didn’t peak until two years later (2020). For those two years, representation was consolidating. We had fewer shows, but more queer characters packed into each one. This meant ensemble casts were doing the heavy lifting, as were Queers of the Week.
When the first leg of queer rep collapsed (shows), the second (characters) was soon to follow.
You can see the aftermath in the churn. In 2025, 59 shows with queer characters ended and only 20 premiered. That’s nearly three cancellations for every new show. And for perspective, new shows peaked at 172 back in 2019. From 172 to 20 in six years is an even steeper fall than the character count.
Among the shows we lost was Neighbours, which ended after 40 years on the air. When the long-running shows go, they take decades of accumulated representation with them, and there’s nothing in the pipeline replacing them.
Fewer Deaths Isn’t Good News
Here’s a stat that looks like progress and isn’t: we only lost 16 characters in 2025, down from a peak of 89 in 2018. Before anyone celebrates, remember that dead characters require living ones first. There are simply fewer queer characters around to kill. This means that the death rate hasn’t meaningfully improved, it means the available character pool to kill has begun to dry up.
And the underlying pattern is as grim as ever. Of the 37 tropes we track, Bury Your Queers remains the most common harmful one, appearing on 424 shows. Compare that to the 163 shows where a queer character gets a happy ending. A show in our database is 2.6 times more likely to kill off a queer character than to give one a happy ending. That number is now front and center on the new shows statistics page, because I think it deserves to be.
What Else the Redesign Surfaced
A few more things that jumped out while I was rebuilding these pages:
- Only 13 shows have ever scored 90 or above on our scoring system. The overall average sits at 53.
- Just 12.3% of shows feature a character with at least one intersectional identity.
- There were 22 non-binary characters on air in 2025, out of 334 total.
- 1 in 12 shows carries a trigger warning.
It’s not all doom. Nearly two thirds of shows still earn a clear “worth it” rating, and 2025 still gave us The Mighty Nein premiering with 8 queer characters, the biggest debut of the year. Quality is holding on by it’s fingernails. There’s just far, far less of it.
All of this is live on the redesigned statistics pages and the This Year archives, recalculated daily as we work through the backlog. Go poke around. And if there’s a stat you wish we tracked, have a shout in the comments.
One thing I’ve noticed increasingly is the way that shows are being cancelled so quickly. And very often they are shows with queer people in them.