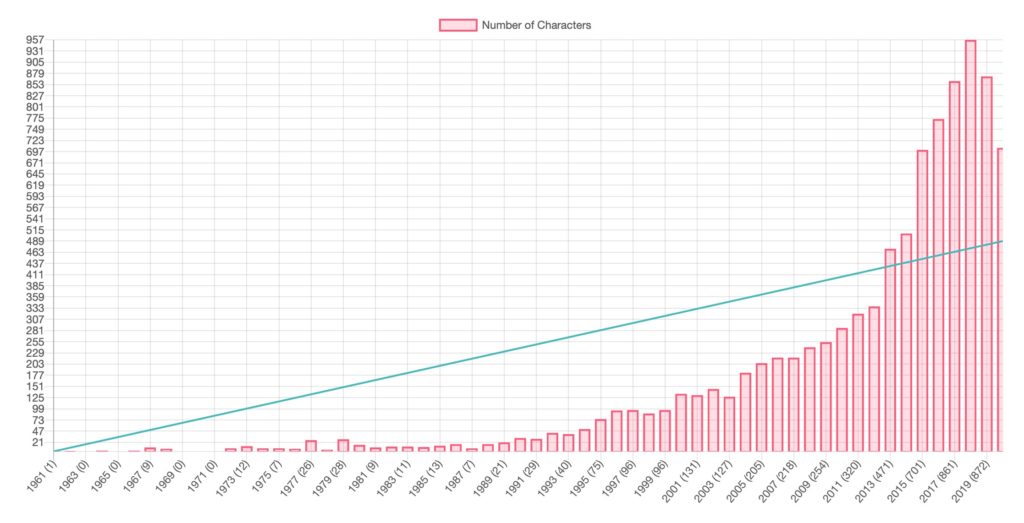
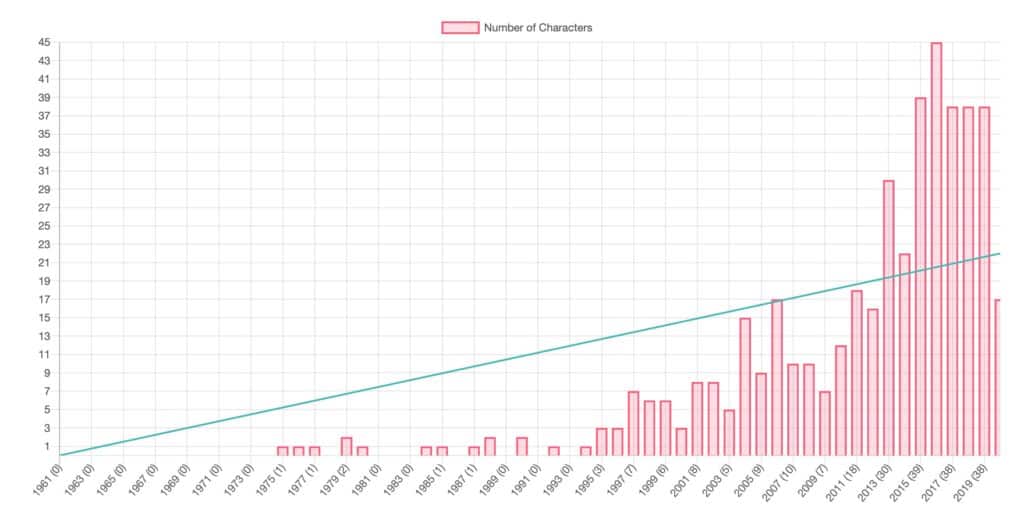
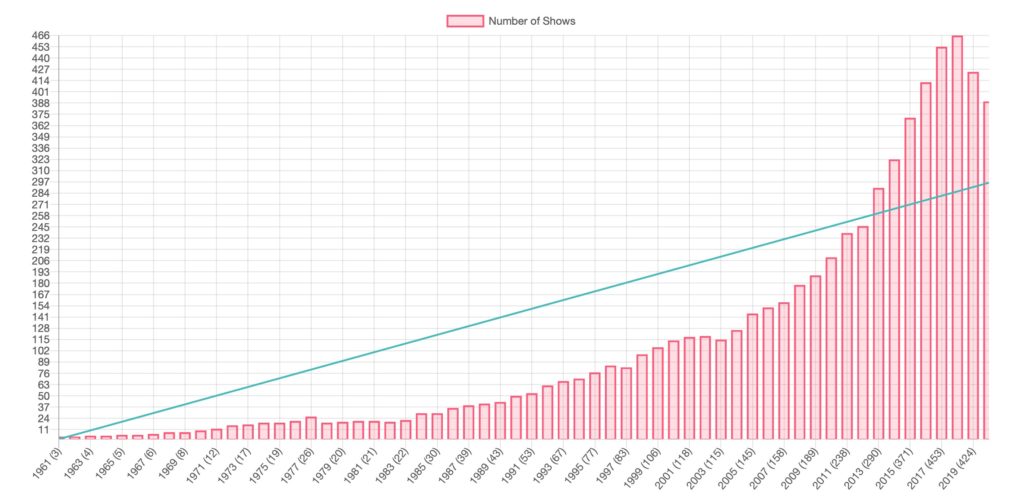
Now that we have the stats on how many characters there are per year, people wanted to know how the stats on characters on air relate to death.
The Cliff
Pretty much everything looks like the top of the state of Virginia. That is, it’s a slow ramp up, a spike, and then an abrupt drop:

Characters on Air 
Death per Year 
Shows on Air 
The US state of Virginia
Just by looking at them side by side, you can see that there are more spikes with death per year than shows or characters on air. The latter two are clearly gradual climbs ending with a COVID related cliff. That’s why we have to also study the percentages as well as the raw numbers.
| Year | Characters | Dead | % Dead |
|---|---|---|---|
| 2020 | 706 | 17 | 2.41% |
| 2019 | 872 | 38 | 4.36% |
| 2018 | 957 | 38 | 3.97% |
| 2017 | 861 | 38 | 4.41% |
| 2016 | 773 | 45 | 5.82% |
| 2015 | 701 | 39 | 5.56% |
Thanks to that table, you can see that 2015 and 21016 are objectively the worst years for character death, even though there is only one character death difference between 2015 and 2017, but over a full percentage point difference. And similarly, 2017, 2018, and 2019 have the same number of dead characters, but the percentages are notably different.
Is it Growth?
To understand why the percentage of characters who died appears erratic, it helps to look at the overall growth in percentages instead of raw numbers.
| Year | Character Growth Percentage | Death Growth Percentage | Percentage of Dead Characters |
|---|---|---|---|
| 2020 | -19.04% | -55.26% | 2.41% |
| 2019 | -8.88% | 0.00% | 4.36% |
| 2018 | 11.15% | 0.00% | 3.97% |
| 2017 | 11.38% | -15.56% | 4.41% |
| 2016 | 10.27% | 15.38% | 5.82% |
| 2015 | n/a | n/a | 5.56% |
Through this, we can see that while the death ‘growth’ was flat between 2017, 2018, and 2019, the nearly 9% drop of characters from 2018 to 2019 is the cause for the reverse in the percentages of dead characters in those years.
The Lexa Line
When I study these numbers, I consider 2016 to be the Lexa Line. That is, it’s the demarcation where everything did not so much change as became more clear. When you look at representation in shows-on-air per year, the growth surpassed the trend line in 2013 (the year before we began this site). When you look at representation in characters-on-air per year, the jump happens also near that time, with an astounding 39.76% growth in characters on air from 2013 to 2014, and then again with a 48.83% jump between 2014 and 2015.
That means our peak growth occurred in 2015.
And the growth of death from 2014 to 2015? A mind boggling 77.27% change.
77% more characters died in 2015 than 2014.
We only saw a 49% increase in characters on air for that same period.
Character Death Rates are Unrelated
The conclusion here is a little strange.
The number of queer female, non-binary, and transgender characters who die on TV are not directly related to the number of those characters on-air in the same calendar year. There is, of course, a small relation. More characters means more death. But at the same time, there were spikes of death in 2004 and 2007 that only exist there, and not in shows or characters on air.
In other words, we cannot say that we only saw an uptick of character death in 2015 due to the higher number of characters.

Hi Mika!
Thanks for such a great analysis! I’ve been ruminating over the number of lgbt characters/stories I’m noticing on shows and I wondered what your thoughts were on the COVID cliff? It seems so much more (to me) that tokenism is the ‘safe’ path, like they’ve ticked all the boxes. Now, with COVID, and more cancellations, that it’s leading to fewer lgbt characters (even if there might be less death). How do you see COVID TV shaping up for 2021?
My gut tells me COVID will result in a lot more canceled shows, which means a big drop in on-air presence whenever we get back to filming 🙁 BIPOC and queers are the first to go.
I would be interested to see this breakdown by country of origin and medium (TV, YouTube, etc..)
Yeah, I need to start auto-generating the raw data in a way to make that easier to sort 🙂