I ran into this interesting tweet by Tech Data, where they checked into the google relevant searches of popular TV shows after the end:
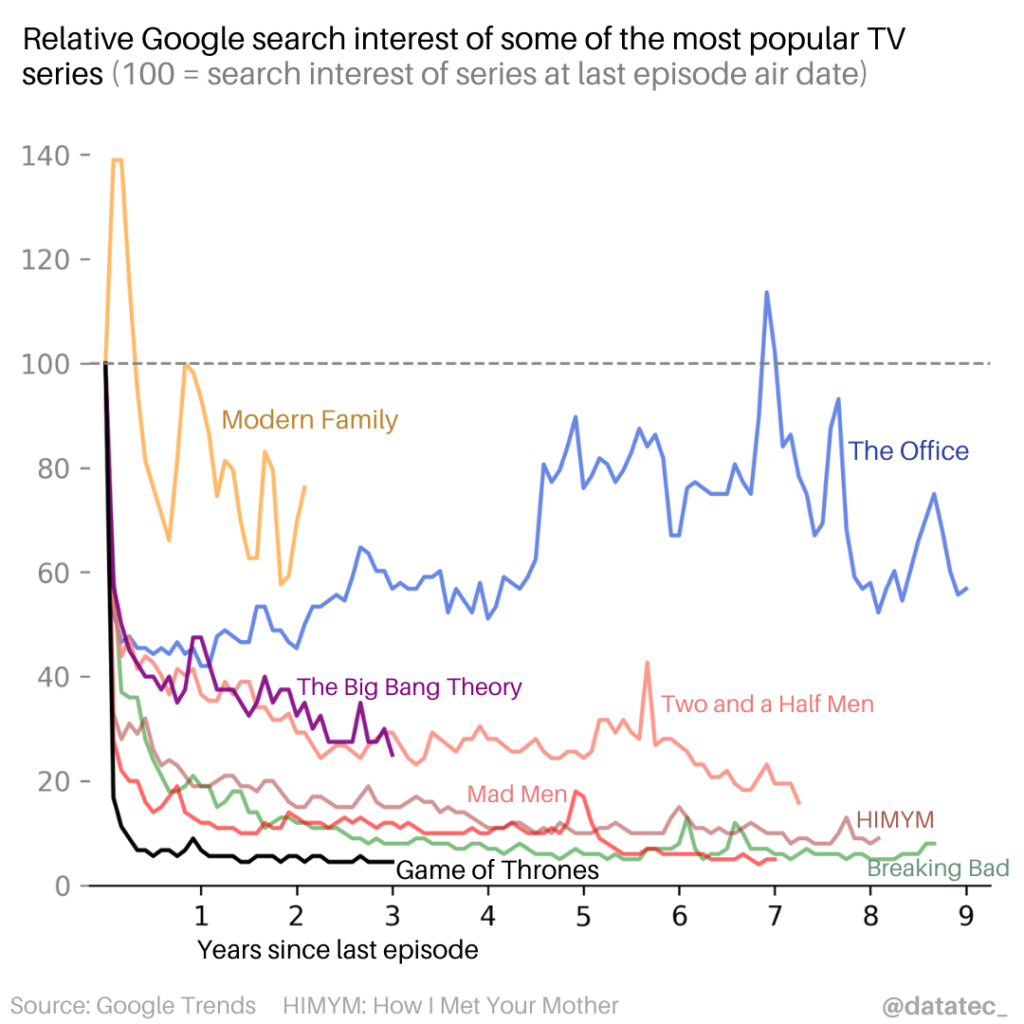
As they put it, Game of Thrones had the most significant drop-off, which may be relate to how despised the ending was.
So I started wondering if there was a relation to some modern shows we love, with their good and bad and non-existent ending.
Recent Victims
The first thing I did was start by looking at a few recent shows.
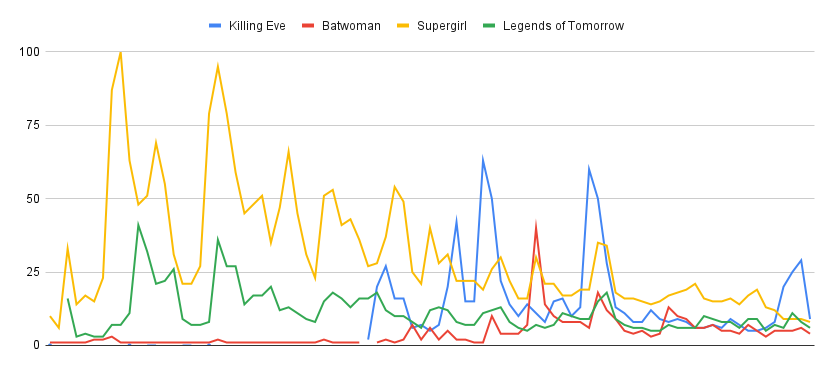
This chart shows you their ‘search ranking’ (or rather, how many people search for them) over time, from the first airdate to the last. Batwoman (the red line) is interesting since there was a lot of interest pre the show airing.
Killing Eve (the blue line) has a few steep drops, directly related to when each season airs, but that peak for season 4 is very, very low. And the drop is the steppest ever. Given how many of us hate the finale, it’s not a shocker. I also thought it was interesting how stable Batwoman and Legends are.
But the chart I was using was taking ‘100’ as the ranking for the day of the final episode, which means looking for things that were canceled now is going to give me a very short result, not to mention a confusing one…

So it was time to do it the other way.
Bring out Your Netflix Dead
This time, I picked older shows that are a mix.
- Sense8 – canceled without conclusion, allowed a wrap up movie
- One Day at a Time – canceled without conclusion, moved to Pop, canceled again
- Teenage Bounty Hunters – canceled without conclusion
- Orange is the New Black – planned cancellation
- GLOW – canceled but had a kind of conclusion
Those are all Netflix shows, and if you look at the raw search-interest over time, OitNB is messing up my metrics!
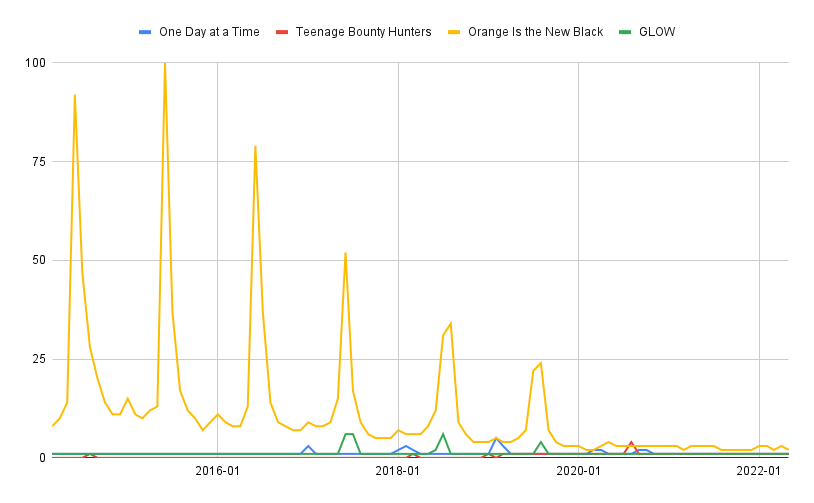
Okay, but what about after the show was over?
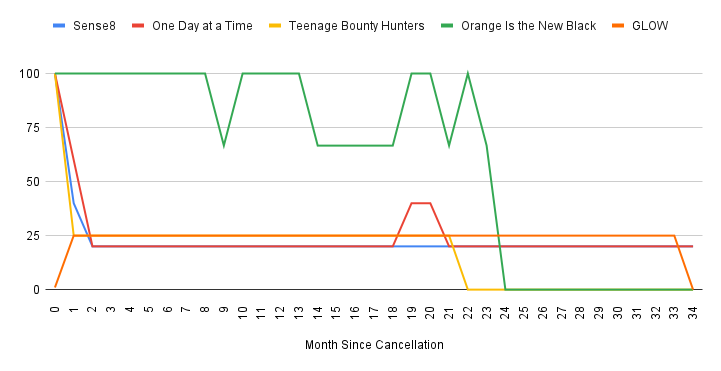
Now things look a little different. OitNB remained popular for 24 months (2 years!) after the finale. In fact … Most everything did. Even GLOW (which has a dip due to when in the month it was released) had people searching for it after cancelation.
However you’ll notice those are months and the original was years. Okay then.
Blast from the Past
I wanted to pull out moldy-olds like Xena: Warrior Princess but Google’s trends only go back to 2004 and Xena ended in 2001. And after some juggling, I decided to show you how things go for two of the more globally recognized series:
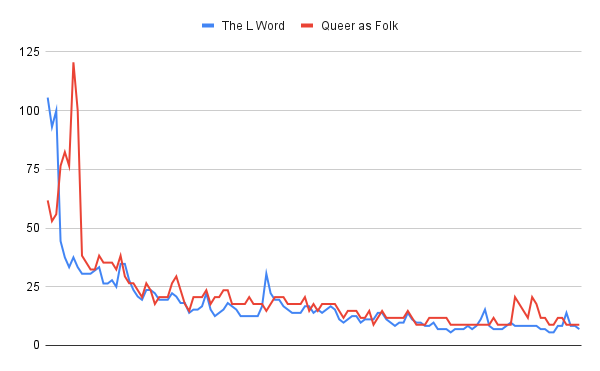
I used the search ranking of the month of the show finale as the marker for ‘100’ and everything is based off of that. Interestingly, yes, Queer as Folk (US) had a jump above their finale! That timing is actually the month before, and since it ended August 7, 2005, that kind of tracks. Most of the search was before the finale wondering what’s going to happen next week.
You don’t really see that with The L Word though. Instead you see a steady watch rate that drops. Both shows had very similar down-trend, though, remaining somewhat popular.
The fun part is I wanted to show you some lesbian classics but I found out something hilariously brilliant.
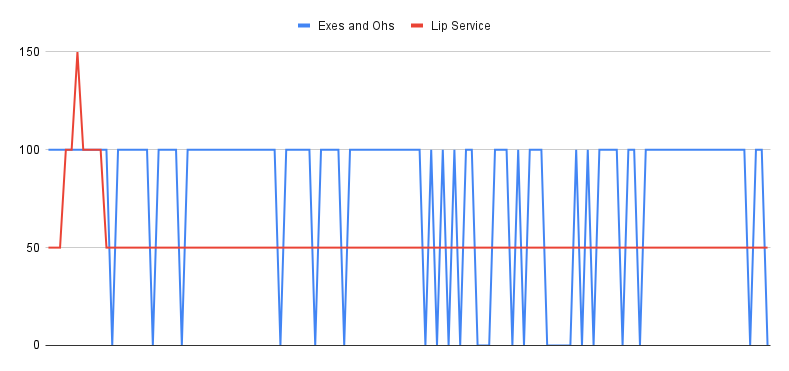
Now if you notice, Exes and Ohs and Lip Service are insanely stable. It’s been 10 years, people still search for them.
Of course, compared to everything else, they’re barely searched for. But relatively? Well, that leads us to our conclusion!
The Conclusion: Queer Content Never Dies
First, I’ll have to wait a couple more years before I can tell you if Killing Eve is pulling a GoT time disaster.
Second, I don’t think it will because, as evidenced, queers keep looking for the content, and if we don’t find it, we go back to what we know.
Which means third, queer content never really dies. Instead of throwing it away, queers fight back. Without even looking, I bet that there is a major uptick of people ‘fixing’ the finale of Killing Eve. Similarly, I bet there is not a major uptick for Wynonna Earp, which ended happily (albeit too soon).
Finally, fourth, the reason for all this is a relative dearth of content. Oh sure, we have almost two thousand shows but that’s out of somewhere around two million.

Even if that number includes non-scripted TV, dropping it down to a million means .2% of all TV shows in the history of ever had queer women, non-binary, and/or transgender characters. We could be generous, and say 1% had queers at all.
We have a long way to go until we hit parity, and until then, the search results for your favourite rare queer show will never stop.
