A year ago I wrote about why it doesn’t feel like it’s getting better. In that article, I explained that while we are, in fact, getting more shows, the growth has slowed and changed.
The issue with looking at the statistics in that way is that I was looking at things ‘mid year.’ If you’re an American, this makes sense. Most of our shows traditionally hit a pause for summer break starting around now. However with the advent of streaming media and year-round programing, this is no longer something reliable.
That means when you look at statistics mid-year, you get a partial view of growth.
The Last Five Years
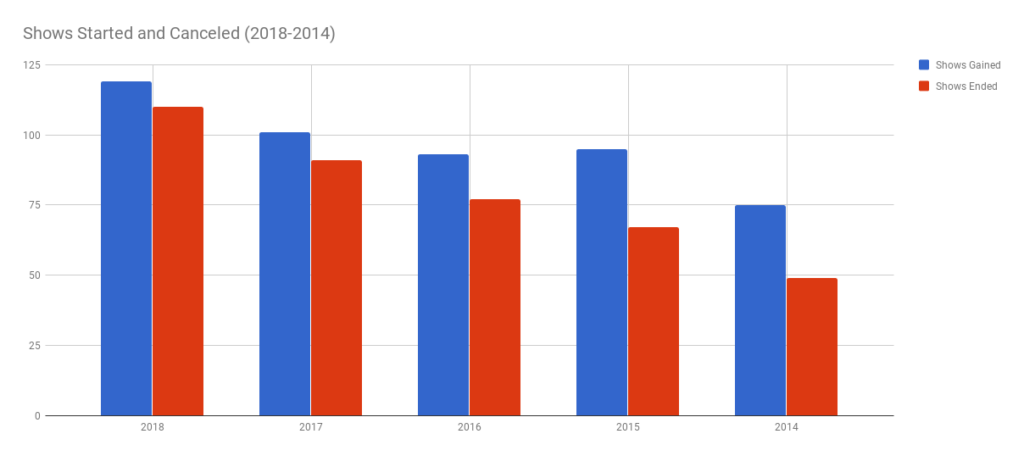
Taking in the complete view of the last five years, the first thing you should notice is that 2019 gained 111 shows on air from June to December. That worked out to be an additional 88 shows that started. Some of this numerical oddity is due to late cancellations and extensions from shows that were purported to be canceled and were not (like Timeless). We also lost an additional 59 shows and 22 characters.
| Shows On Air | Shows Started | Shows Ended | Dead Characters | |
| 2018 | 405 | 119 | 110 | 31 |
| 2017 | 349 | 101 | 91 | 33 |
| 2016 | 325 | 93 | 77 | 43 |
| 2015 | 299 | 95 | 67 | 38 |
| 2014 | 253 | 75 | 49 | 20 |
It’s not surprising to see those numbers basically double (except for dead characters) over the summer, as September remains the time that most new shows are released. However even with that information the facts are pretty clear.

The number of shows with queer female, transgender, and/or non-binary characters is not increasing significantly. This indicates a slowing of the growth. In other words, we’re barely keeping pace with growth instead of exceeding it like we were in 2014 through 2017.
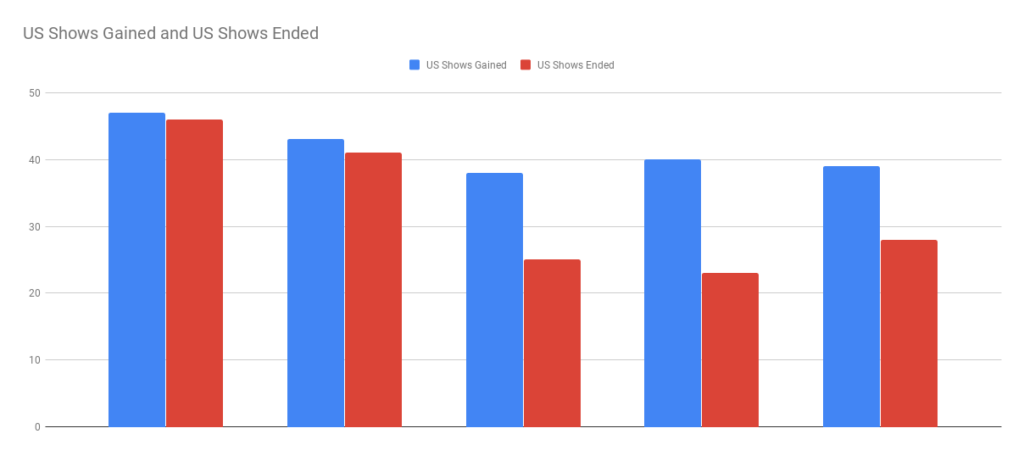
Even if you break it down to just shows airing in the US, the pattern remains the same.

This may be due to the slowing of growth on TV overall. Even so, if we consider the statistics that tell us there were 8 more scripted television show in 2018 than 2017, you would expect to see a similar growth in shows with queer representation. That is, we would see the difference between new and cancelled shows match. Instead, we’re seeing the pace match. The lines are growing closer.
June to June
Looking at 2019, we’re on pace to be similar to 2018.
| Shows On Air | Shows Started | Shows Ended | Dead Characters | |
| 2019 | 320 | 26 | 51 | 10 |
| 2018 | 294 | 31 | 44 | 9 |
While we reached June with more shows on air, we’ve gained fewer and lost more. We also have more dead characters. This trend matches with the previous year, and seeing as 2018 held true to the changes from 2000 through 2017, I see no reason for this to not continue.
If I extrapolate the data change from the last year to this year, I predict we’ll end 2019 like this:
| Shows On Air | Shows Started | Shows Ended | Dead Characters | |
| 2019 | 441 | 99 | 127 | 35 |
If this year continues the trend of the last two, we’ll finally see the flip where, at year end, we’ll have lost more shows with rep than we’ve gained.
Never Tell Me The Odds
There are a few bright spots that may cause this prediction to be wildly wrong.
The first, and most important, is the CW. With Batwoman coming out in the 2019-20 season, we have at least one show that is going to skew the numbers. In fact, nearly all of the CW shows now have at least one queer character. There are also a few queer oriented shows that have come out, like Armistead Maupin’s Tales of the City.
There are also a number of other mainstream shows that are expected to have at least one queer character. However, networks have been less willing to take a long chance on shows. This is evident in what happened with Abby’s just recently. And the reality of Cancel Culture with scripted television is why that prediction has a pretty good chance of being true.
All that said, I do expect the prediction of dead characters to be wrong. After the spike of 2016, we’ve been dropping back down to high but more reasonable levels.
