Looking back on 2022, I thought I’d try my hand at displaying the status of the year in a slightly different format. Sure the “This Year” page for 2022 has a lot of data, but digesting data is often helped by looking at the format differently.
747 Characters on Air
2022 saw an drop of characters on air. 2020 was the peak with 1059 characters.
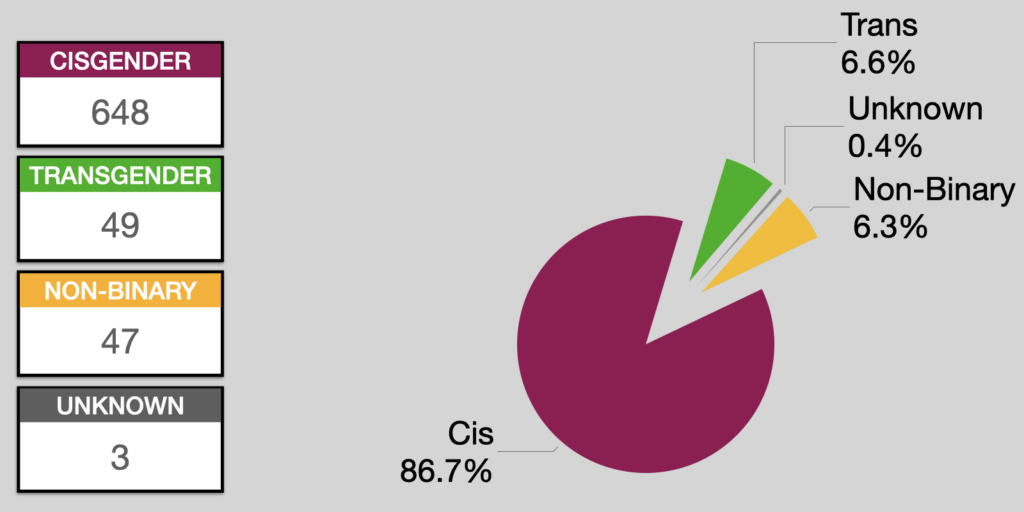
Looking at the breakdown of character types, we still have a surfeit of cisgender representation!

The data is combined, as we mark 13 separate gender identities, so transgender encompasses transgender men and women, and trans-non-binary. There is a little overlap, as trying to breakdown each one individually makes the chart (currently) unreadable.
| Number of Characters | Percentage of Characters | |
|---|---|---|
| CISGENDER | 648 | 86.7% |
| TRANSGENDER | 49 | 6.6% |
| NON-BINARY | 47 | 6.3% |
| UNKNOWN | 3 | 0.4% |
Given the nature of television, this isn’t surprising.
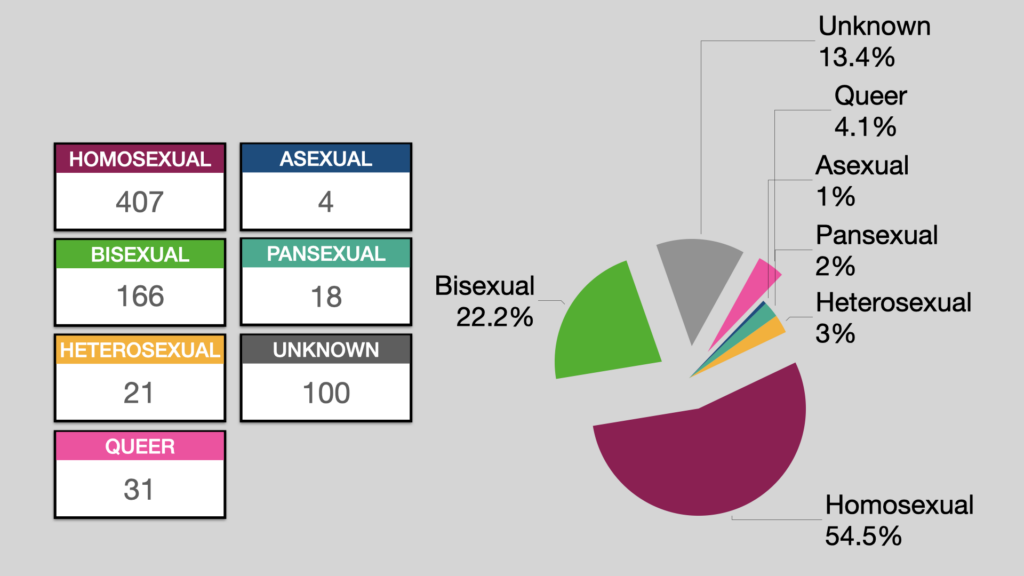
What is a little surprising is that the breakdown of sexuality is wider:

Even with the ‘combining’ of LGBTQ+/Queer/not-straight/non-monosexual as ‘Queer’, it’s still painfully low. But that said, there are ‘enough’ asexuals and pansexuals to start making a visual dent!
| Number of Characters | Percentage of Characters | |
|---|---|---|
| HOMOSEXUAL | 407 | 54.5% |
| BISEXUAL | 166 | 22.2% |
| HETEROSEXUAL | 21 | 3% |
| QUEER | 31 | 4.1% |
| ASEXUAL | 4 | 1% |
| PANSEXUAL | 18 | 2% |
| UNKNOWN | 100 | 13.4% |
This is the direction I hope to see gender representation moving!
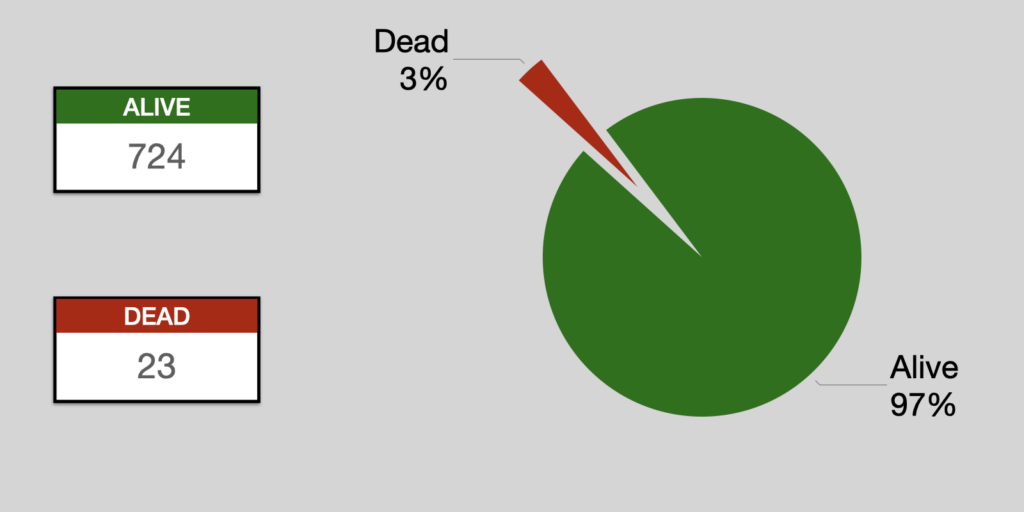
23 Dead Characters
Thankfully this is lower than it’s been in recent years.

| Number of Characters | Percentage of Characters | |
|---|---|---|
| ALIVE | 724 | 3% |
| DEAD | 23 | 97% |
Obviously we want more alive than dead.
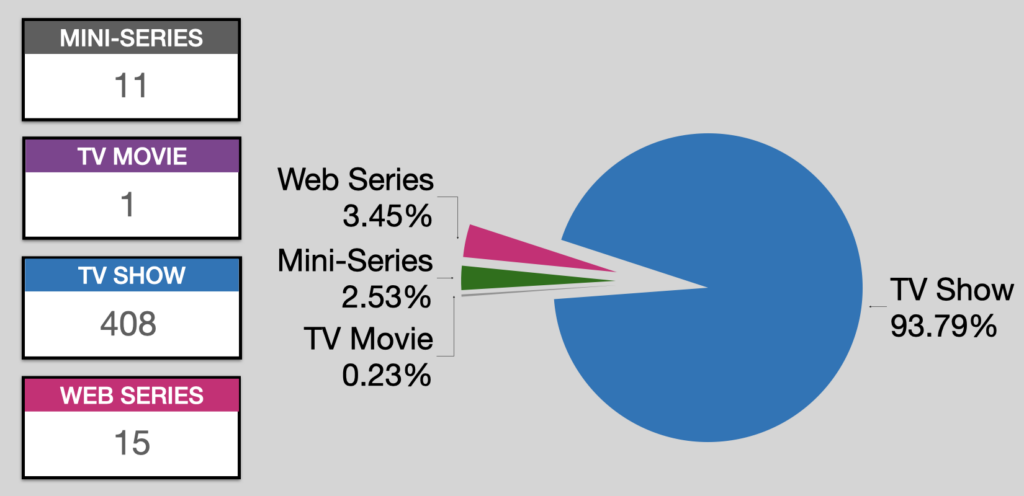
435 Shows on Air
This is a startlingly lower number than years prior. This matches some of the data I’ve been sharing over the years, but yes, we’re getting fewer shows.
Interestingly that works out to 1.7 queer characters per show listed. Which is dreadfully low.

| Number of Shows | Percentage of Shows | |
|---|---|---|
| MINI-SERIES | 11 | 2.53% |
| TV MOVIE | 1 | 0.23% |
| TV SHOW | 408 | 93.79% |
| WEB SERIES | 15 | 3.45% |
Webseries was a little low in 2022, possibly due to covid. TV Movies are always a weird metric, since they do skew a little Halmarky, and up until recently they had lacking representation.
What’s Next?
I’m actually working on putting some of these graphics onto the yearly pages, so everyone can look whenever they want, in an automated fashion but, for you, you get my clumsy attempt at something a little infographish.
But I do find that looking at things year by year gives you a little different idea of where we need representation to grow.
